
Landsat and the Prairie Potholes
Published:
For the last year, most of my research has focused on the evolution of nearly a million lakes, ponds and wetlands across the North American interior. Many of these are collected in the Prairie Pothole Region (PPR) which extends across the Dakotas, Iowa, Minnesota and large parts of southern Canada as well. These are a fairly unique set of habitats and environments because people have been living and working all across them since homesteading days but we have yet to achieve a complete understanding of their complex interactions between climate and ecosystem. Since the defining characteristic of the region is that it is flat, there are multitudes of shallow depressions which are subject to drought-and-deluge cycles of wetland filling / emptying. A wide range of highly specialized plant and animal species has come to inhabit these potholes despite these difficulties.
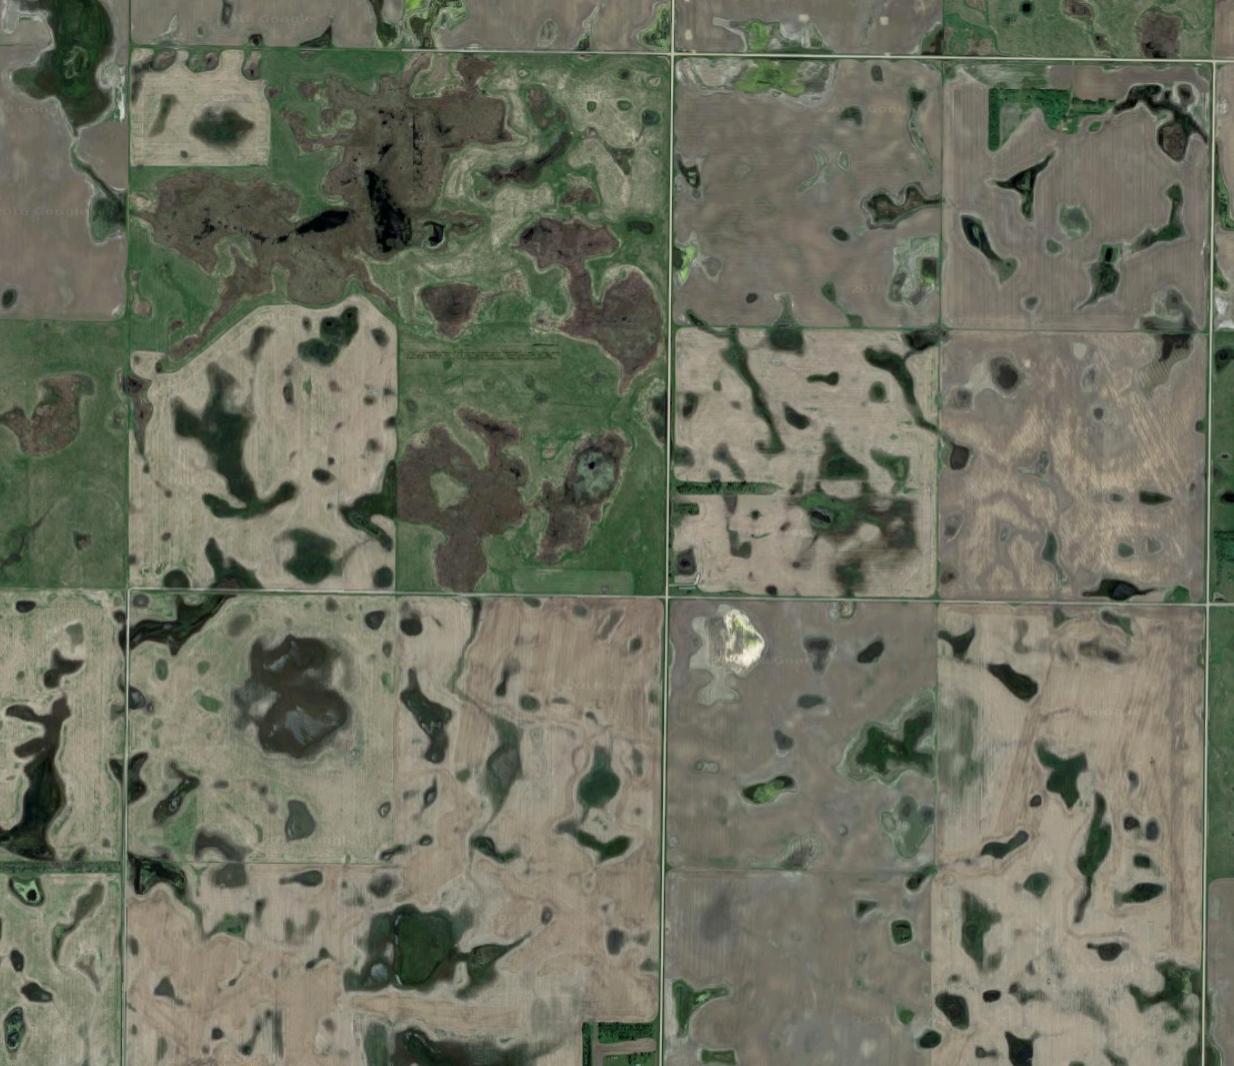
Google Maps’ standard imagery for several sections in southeastern North Dakota. Can you spot the artificial drainage channels?
For my part, I’m concerned with the hydrology of the region. Since there are few rivers, a single streamflow gauge won’t record much information. Furthermore, it appears that the most substantial driver of pothole water levels is the seasonal snowpack accumulation that melts in spring. These two facts make it extremely difficult to make comprehensive, long-term assessments of the hydrologic variability of the potholes at scales greater than a few square miles.
Enter Landsat
The incredibly large number of water bodies in the PPR is both blessing and curse; while it is impossible to record water depth and other important system variables at each and every site, there is a practically infinite number of replicates from a statistical perspective. However, the interactions and feedbacks between neighboring potholes is hotly contested and, if a consensus is ever found, it will have major implications for enforcement of federal law.
The tools for studying approximately one million water bodies over decades are relatively limited and there are really only two sources of data in this part of the world that have the needed fidelity. Aerial imagery taken by the Department of Agriculture for a variety of ag-related purposes has great resolution and can often be found stretching back to the 1950s, but is typically available for only a few years for each decade. Satellite imagery from the Landsat program, on the other hand, is available for most months since the early 1980s for virtually all of North America. Furthermore, it has made public within the last few years and is easily accessible through a range of data portals and even free (as in beer, not speech) cloud processing tools for big data analysis.
30 years of rain and sun in Dickey County, North Dakota as recorded by Landsat. Nearly 15 years ago, I shot my first duck in the smaller of the two recurrent ponds near the center of the image.
These snapshots of the environment across a range of temperature, precipitation and management conditions are already revealing some interesting—and in some ways, counterintuitive—results. Rainfall has been much higher than historical averages for the past 15 years and the amount of total land underwater is dramatically higher than before. However, the gains have been unequal in the sense that there appears to be a strong signature that many wetlands are being artificially drained. The details of disentangling natural and human-driven effects from 900 kilometers in the sky are fairly involved - I’ll put them in a future post.